
Mastering Exposure: How to Use the Histogram for Perfect Tones
The histogram is a powerful tool that can help you ensure proper exposure in your photographs. It provides a visual representation of the distribution of tones in your image, from the darkest shadows to the brightest highlights. By understanding how to read and interpret the histogram, you can make adjustments to your camera settings or post-processing to achieve a well-exposed photo.
Most cameras allow you to display a histogram on the rear screen both before you take a photo, and when you view one you have already taken. Post processing software such as Adobe Lightroom and Photoshop will also display a histogram of the image you are working on.

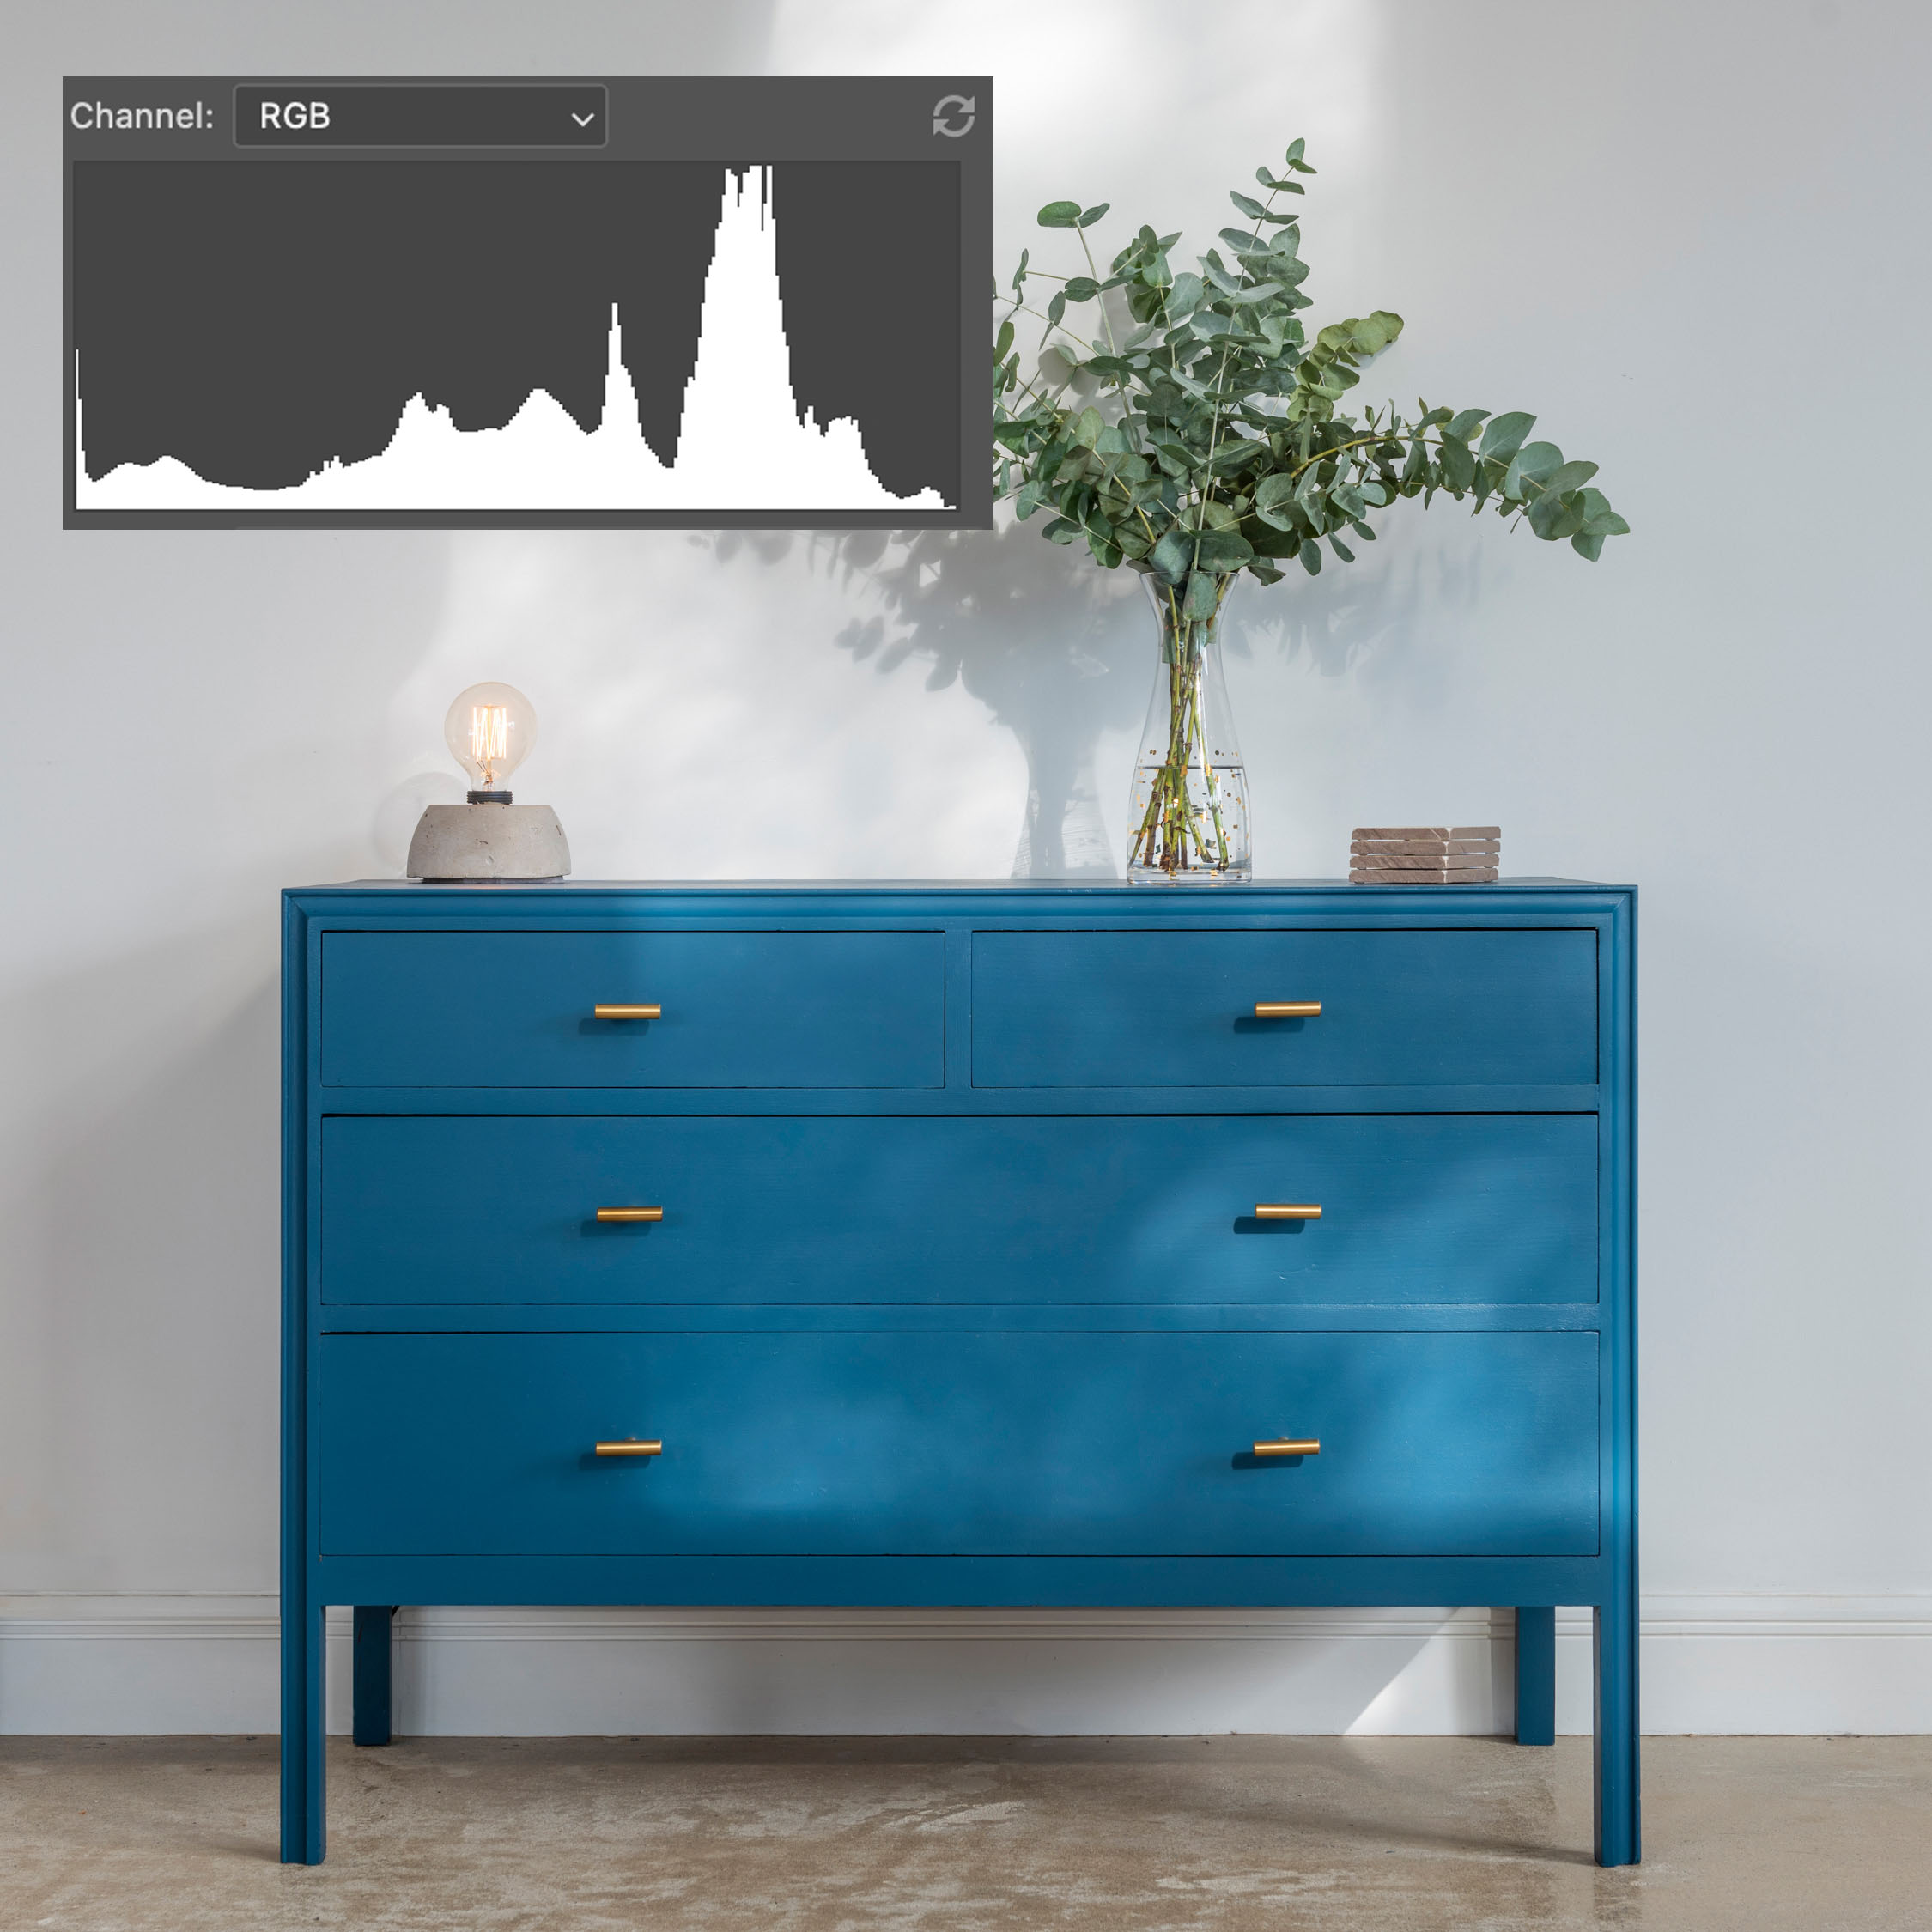
When you look at a histogram, you will see a graph with a horizontal axis representing the range of tones from pure black on the left to pure white on the right. The vertical axis represents the number of pixels at each tone level. The shape of the histogram can vary depending on the image, but ideally, you want a balanced distribution of tones without any clipping at either end.
If the histogram is skewed towards the left, it can mean your image is underexposed, with a lack of detail in the shadows. In this case, you may need to increase the exposure by adjusting your camera settings or brightening the image in post-processing.
Conversely, if the histogram is skewed towards the right, it can indicate overexposure, with a loss of detail in the highlights. To correct this, you can decrease the exposure or darken the image during editing.
By examining the histogram, you can also identify if any areas of your image are completely black or white, which suggests clipping. Clipping means that the details in those areas are lost, and you may need to adjust your exposure settings accordingly.
Remember, the goal is to achieve a well-balanced histogram with a good distribution of tones throughout the image. However, keep in mind that the ideal histogram can vary depending on the subject and desired creative effect. A photo with a large amount of light tones (a snow covered landscape perhaps) even when correctly exposed, will result in a histogram that is skewed to the right, so don't be afraid to experiment and trust your artistic vision.

Similarly, an image with mainly dark tones will have a histogram that shows more tones on the left:

In conclusion, using the histogram to check the exposure and make adjustments is a simple yet effective way to ensure your photos are properly exposed. It allows you to analyse the distribution of tones and make informed decisions to achieve the desired outcome. So, next time you're out shooting or editing your images, don't forget to consult the histogram and make the necessary adjustments for a perfectly exposed photograph.